Grade 7 - Unit 2
Biomes
Lesson 1 - What Are Biomes
|
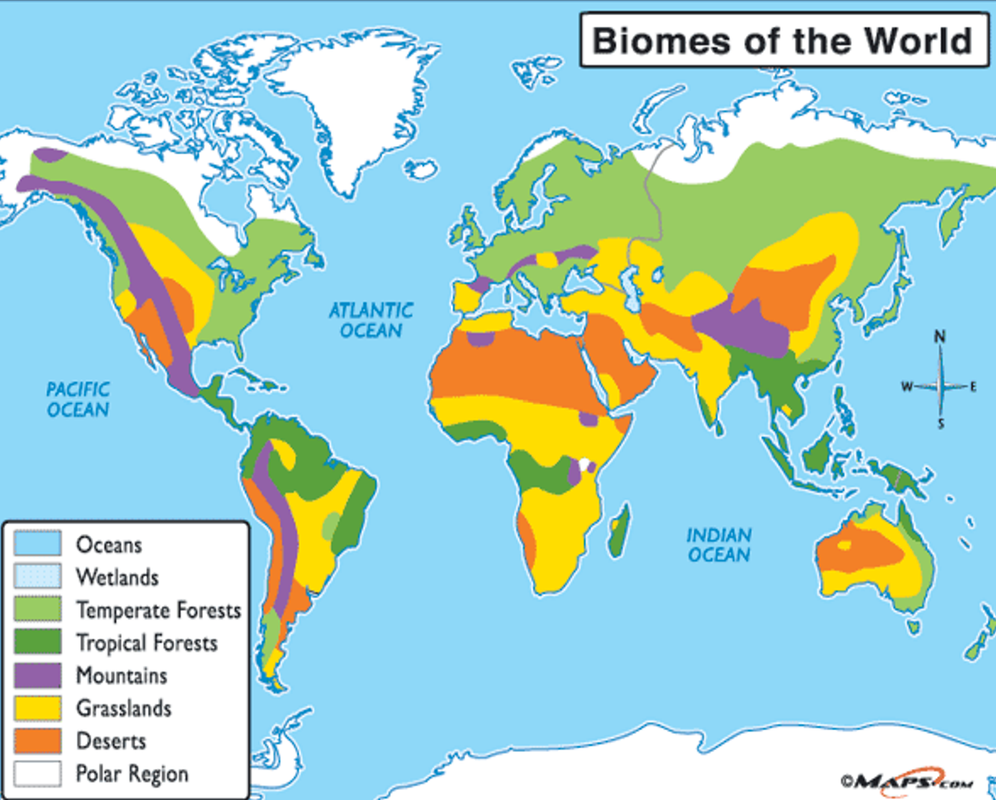
Biomes are large areas around the world that share similar vegetation, climate and wildlife. There are similar biomes in different parts of the planet. For example, deserts can be found in Asia, Africa, North and South America, and Oceania. Biomes are important because they provide an indication of the climate, vegetation and animal life. They also show us how life has adapted to these different areas on the planet. There are two categories of biomes, terrestrial (land) and aquatic (water). For this unit, we will focus on terrestrial. |
|
Lesson 2
Lesson 3
|
Now that you know some of the different types of biomes, it is time to demonstrate this understanding. You will do this by creating a chart (see the template). The first column in the label. The second column should be a picture of this biome. Column three is where you explain what it looks like. Be sure to use as many adjectives as possible! In the fourth column, you should describe the climate of this biome. In the last column provide at least three different examples of this type of biome. Lastly, do not forget to cite all sources in APA format!
|
You must include the following biomes:
|
Lesson 4

In order to fully understand biomes, you must understand the difference between climate and weather.
Weather is the current state of the atmosphere whereas climate is the average weather over a long period of time (usually 30 years).
It is the climate which determines what a biome looks like. The amount of precipitation and the temperature affect what can grow there and therefore what animals can live there.
For more information on the difference between climate and weather, click here.
Lesson 5
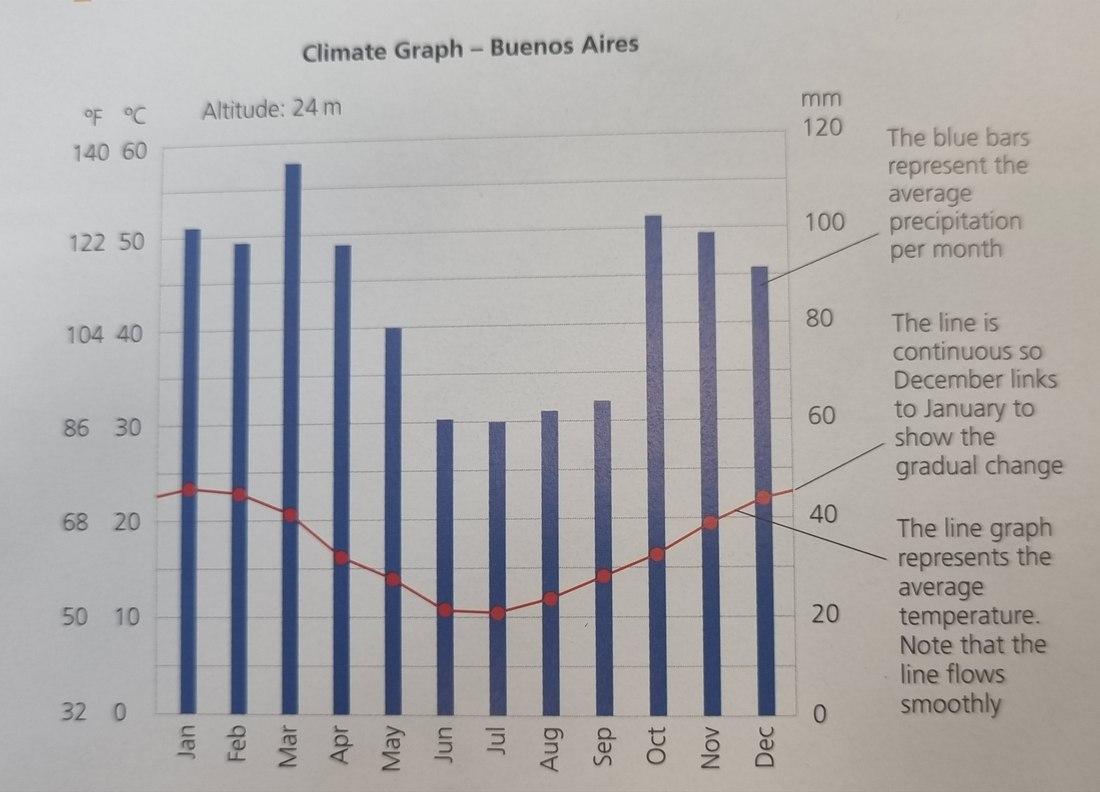
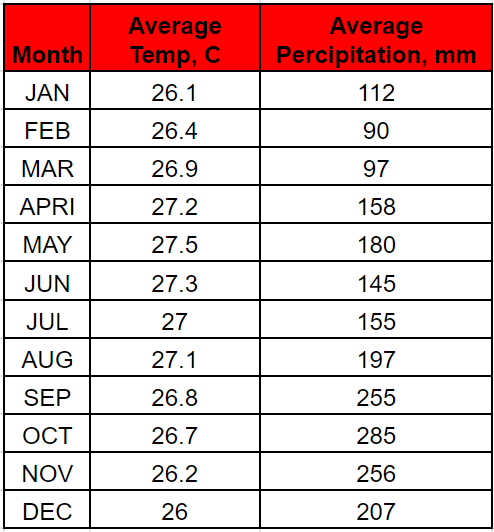
The climate of a location can be recorded using a climate graph. A climate graph shows the average temperature and precipitation in each month. Start by looking at the climate data and graphs for Buenos Aires and Medan. Figure out the hottest, coldest, wettest, and driest months for both cities. Then calculate the average precipitation for the entire year in both cities.
|

Climate Data for Buenos Aires
|
Climate Data for Medan
|

|
Your Turn
|
Look at the table to the right. This table shows climate data for the Saudi Arabian capital city of Riyadh. Your task is to construct a climate graph for Riyadh. When you have constructed the climate graph, write two paragraphs to describe the overall climate of the city. Within your response explain what biome you think Riyadh is in and why.

|

Climate Data for Riyadh
|
Summative
|
You are to create a magazine article on the natural environment of a country of your choice. Within your article, you should consider the following: What you should focus on:
|

|
